47,038
AFA false alarms attended in 2025
76.2% of the Brigade’s 61,751 false alarms
Every automatic fire alarm false alarm London Fire Brigade attended from 2019 to 31 July 2026, by borough, by type of building and by time of day. Compiled by Gemini AMPM from the Brigade’s own open incident records.
2025, all of London
47,038
automatic fire alarm false alarms attended by London Fire Brigade
What is counted. An AFA false alarm here is an incident London Fire Brigade attended and recorded as a false alarm from an automatic fire alarm. Alarms that sounded and were not attended are not in the data. How the Index is built.
On 29 October 2024 London Fire Brigade changed how it responds to automatic fire alarms. Between 07:00 and 20:30 it no longer attends one at most non-residential buildings unless a person also calls 999 to report a fire. Homes, hospitals, schools, care homes, hotels and the other premises on the Brigade’s exemption list still get a response at any hour.
In the year before the change the Brigade attended 13,713 AFA false alarms at non-residential buildings in those hours. In the year after it attended 6,396. That is a change of -53.4%.
The year before the change against the year after it. The shaded band is 07:00 to 20:30, the hours in which the Brigade no longer attends most non-residential automatic fire alarms.
| Half hour starting | Year before | Year after |
|---|---|---|
| 00:00 | 255 | 237 |
| 00:30 | 236 | 218 |
| 01:00 | 214 | 230 |
| 01:30 | 205 | 180 |
| 02:00 | 226 | 200 |
| 02:30 | 193 | 171 |
| 03:00 | 185 | 182 |
| 03:30 | 207 | 170 |
| 04:00 | 175 | 181 |
| 04:30 | 198 | 176 |
| 05:00 | 207 | 182 |
| 05:30 | 245 | 210 |
| 06:00 | 305 | 299 |
| 06:30 | 303 | 301 |
| 07:00 | 394 | 185 |
| 07:30 | 458 | 179 |
| 08:00 | 535 | 217 |
| 08:30 | 608 | 280 |
| 09:00 | 687 | 290 |
| 09:30 | 653 | 313 |
| 10:00 | 753 | 333 |
| 10:30 | 642 | 329 |
| 11:00 | 730 | 319 |
| 11:30 | 644 | 275 |
| 12:00 | 574 | 295 |
| 12:30 | 575 | 256 |
| 13:00 | 580 | 245 |
| 13:30 | 531 | 237 |
| 14:00 | 559 | 286 |
| 14:30 | 538 | 280 |
| 15:00 | 483 | 243 |
| 15:30 | 472 | 184 |
| 16:00 | 419 | 192 |
| 16:30 | 357 | 176 |
| 17:00 | 373 | 156 |
| 17:30 | 360 | 161 |
| 18:00 | 398 | 174 |
| 18:30 | 346 | 143 |
| 19:00 | 404 | 155 |
| 19:30 | 334 | 160 |
| 20:00 | 306 | 333 |
| 20:30 | 337 | 284 |
| 21:00 | 313 | 314 |
| 21:30 | 327 | 289 |
| 22:00 | 301 | 292 |
| 22:30 | 291 | 243 |
| 23:00 | 294 | 273 |
| 23:30 | 287 | 242 |
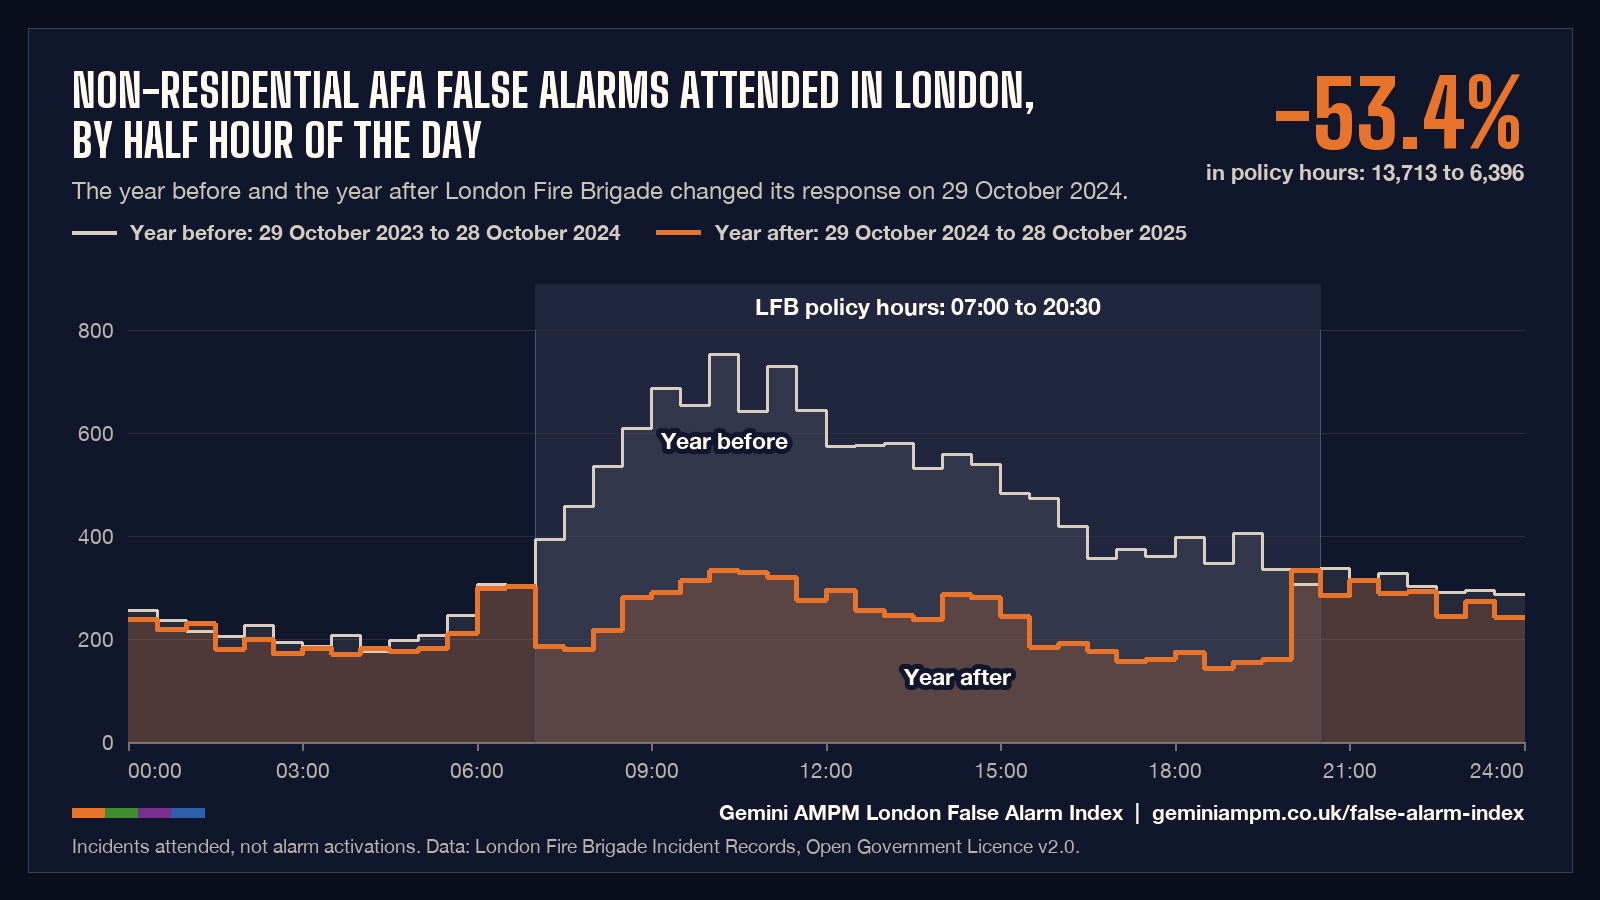
You are welcome to republish this chart, in print or online, with a credit to the Gemini AMPM London False Alarm Index and a link to this page. Copy the code below, or download the image (PNG, 1600 by 900).
| Group | Year before | Year after | % |
|---|---|---|---|
| Non-residential, 07:00 to 20:30 | 13,713 | 6,396 | -53.4% |
| Property types not named as exempt | 10,748 | 3,670 | -65.9% |
| Hospitals, schools, nurseries, prisons | 2,965 | 2,726 | -8.1% |
| Non-residential, outside those hours | 5,304 | 4,874 | -8.1% |
| Residential, all hours | 33,729 | 35,232 | +4.5% |
| All AFA false alarms | 52,793 | 46,536 | -11.9% |
Within that non-residential 07:00 to 20:30 group, attendances at hospitals, schools, nurseries, prisons and young offenders' units (property types that LFB lists as exempt from the change) went from 2,965 to 2,726 (-8.1%). Attendances at all other non-residential property types went from 10,748 to 3,670 (-65.9%). Listed buildings and premises the Brigade has exempted one by one cannot be picked out in the data, so the “not named as exempt” group still contains some exempt buildings.
| Property type (as recorded by LFB) | Before | After | % |
|---|---|---|---|
| Purpose built office | 2,287 | 676 | -70.4% |
| Single shop | 1,519 | 438 | -71.2% |
| Infant/Primary schoolExempt | 1,395 | 1,342 | -3.8% |
| Secondary schoolExempt | 812 | 724 | -10.8% |
| HospitalExempt | 482 | 446 | -7.5% |
| Warehouse | 445 | 36 | -91.9% |
| Large supermarket | 439 | 61 | -86.1% |
| Restaurant/cafe | 404 | 173 | -57.2% |
| Converted office | 399 | 159 | -60.2% |
| College/University | 391 | 350 | -10.5% |
One thing the chart shows that the policy does not say. The published policy hours end at 20:30. In the records, attendance is back at its earlier level from 20:00, 30 minutes sooner. In the year after the change the Brigade attended 160 non-residential AFA false alarms in the half hour from 19:30 and 333 in the half hour from 20:00. The year before, the figures were 334 and 306. The start of the window matches the published 07:00. The data does not say why the end differs, and the published hours are the ones to plan around.
Why this matters to a building manager. The records cannot show how many alarms sounded and went unattended. What they show is that, in a non-exempt building in the policy hours, a crew is no longer sent on the alarm signal alone. Finding out why the alarm went off, and calling 999 if there is a fire, is now the building’s job. What that means in practice.
Non-residential AFA false alarms attended between 07:00 and 20:30, Jan 2023 to Jul 2026. The fall arrived with the policy and has held since.
| Month | Attended | Period |
|---|---|---|
| Jan 2023 | 1,168 | Before |
| Feb 2023 | 1,018 | Before |
| Mar 2023 | 1,154 | Before |
| Apr 2023 | 944 | Before |
| May 2023 | 1,073 | Before |
| Jun 2023 | 1,085 | Before |
| Jul 2023 | 1,166 | Before |
| Aug 2023 | 1,155 | Before |
| Sep 2023 | 1,181 | Before |
| Oct 2023 | 1,250 | Before |
| Nov 2023 | 1,337 | Before |
| Dec 2023 | 1,059 | Before |
| Jan 2024 | 1,157 | Before |
| Feb 2024 | 1,206 | Before |
| Mar 2024 | 1,134 | Before |
| Apr 2024 | 1,083 | Before |
| May 2024 | 1,119 | Before |
| Jun 2024 | 1,037 | Before |
| Jul 2024 | 1,115 | Before |
| Aug 2024 | 1,052 | Before |
| Sep 2024 | 1,148 | Before |
| Oct 2024 | 1,225 | Before (includes the first 3 days after) |
| Nov 2024 | 596 | After |
| Dec 2024 | 524 | After |
| Jan 2025 | 569 | After |
| Feb 2025 | 450 | After |
| Mar 2025 | 469 | After |
| Apr 2025 | 454 | After |
| May 2025 | 512 | After |
| Jun 2025 | 515 | After |
| Jul 2025 | 561 | After |
| Aug 2025 | 565 | After |
| Sep 2025 | 594 | After |
| Oct 2025 | 595 | After |
| Nov 2025 | 564 | After |
| Dec 2025 | 514 | After |
| Jan 2026 | 593 | After |
| Feb 2026 | 537 | After |
| Mar 2026 | 538 | After |
| Apr 2026 | 521 | After |
| May 2026 | 587 | After |
| Jun 2026 | 591 | After |
| Jul 2026 | 563 | After |
AFA false alarms attended in London numbered 41,477 in 2019 and 47,038 in 2025. The highest year from 2019 to 2025 was 2024 with 51,625. The 2025 total was 4,587 lower than 2024 (-8.9%).
Non-residential attendances went from 17,762 in 2024 to 11,211 in 2025. Residential attendances went from 33,815 to 35,796.
2026 is a part year. From 1 January to 31 July 2026 the Brigade attended 28,591 AFA false alarms, against 26,001 in the same dates of 2025 (+10.0%). It should not be set against a full year.
London, by calendar year of the 999 call. 2026 covers 1 January to 31 July 2026 only and is drawn paler.
| Period | AFA false alarms | Residential | Non-residential | Per day | % of all incidents | Change |
|---|---|---|---|---|---|---|
| 2019 | 41,477 | 23,556 | 17,899 | 113.6 | 39.5% | +4.0% |
| 2020 | 37,908 | 23,813 | 14,076 | 103.6 | 38.5% | -8.6% |
| 2021 | 41,762 | 25,760 | 15,965 | 114.4 | 38.1% | +10.2% |
| 2022 | 46,564 | 28,594 | 17,946 | 127.6 | 37.1% | +11.5% |
| 2023 | 49,810 | 31,225 | 18,542 | 136.8 | 39.5% | +7.0% |
| 2024 | 51,625 | 33,815 | 17,762 | 141.1 | 38.5% | +3.6% |
| 2025 | 47,038 | 35,796 | 11,211 | 128.9 | 34.1% | -8.9% |
| 2026, 1 January to 31 July 2026 | 28,591 | 21,739 | 6,834 | 134.9 | 33.2% | +10.0% |
By property category, 30,932 of the 2025 AFA false alarms (65.8%) were at dwellings, 11,211 (23.8%) at non-residential properties and 4,864 (10.3%) at other residential properties such as care homes, hostels, hotels and student halls. Dwellings and other residential property together account for 76.1% of the 2025 total.
Residential buildings are outside the daytime policy, so the Brigade still attends them at every hour. Between the year before the change and the year after, residential AFA false alarms went from 33,729 to 35,232 (+4.5%). The data does not say why.
Property type as recorded by London Fire Brigade crews. The percentage is the share of all AFA false alarms in London.
| Property type | Category | AFA false alarms | % of London total |
|---|---|---|---|
| Purpose Built Flats/Maisonettes - 4 to 9 storeys | Dwelling | 8,426 | 17.9% |
| Purpose Built Flats/Maisonettes - Up to 3 storeys | Dwelling | 6,043 | 12.8% |
| Self contained Sheltered Housing | Dwelling | 4,498 | 9.6% |
| House - single occupancy | Dwelling | 4,446 | 9.5% |
| Converted Flat/Maisonettes - 3 or more storeys | Dwelling | 2,468 | 5.2% |
| Purpose Built Flats/Maisonettes - 10 or more storeys | Dwelling | 2,315 | 4.9% |
| Retirement/Old Persons Home | Other Residential | 2,078 | 4.4% |
| Infant/Primary school | Non Residential | 1,619 | 3.4% |
| Converted Flat/Maisonette - Up to 2 storeys | Dwelling | 1,387 | 2.9% |
| Purpose built office | Non Residential | 1,260 | 2.7% |
| Single shop | Non Residential | 1,071 | 2.3% |
| Secondary school | Non Residential | 943 | 2.0% |
| Nursing/Care Home/Hospice | Other Residential | 654 | 1.4% |
| Hospital | Non Residential | 651 | 1.4% |
| Hotel/motel | Other Residential | 628 | 1.3% |
| Licensed House in Multiple Occupation - Up to 2 storeys | Dwelling | 584 | 1.2% |
| Student Hall of Residence | Other Residential | 532 | 1.1% |
| Hostel (e.g. for homeless people) | Other Residential | 508 | 1.1% |
| College/University | Non Residential | 474 | 1.0% |
| Restaurant/cafe | Non Residential | 381 | 0.8% |
The property type with the most AFA false alarms in 2025 was "Purpose Built Flats/Maisonettes - 4 to 9 storeys" (8,426), followed by "Purpose Built Flats/Maisonettes - Up to 3 storeys" (6,043) and "Self contained Sheltered Housing" (4,498). Among non-residential property types the largest were "Infant/Primary school" (1,619), "Purpose built office" (1,260) and "Single shop" (1,071). A count by property type says where crews were sent. It does not say what set the alarm off or whether the system was at fault.
Westminster had the most AFA false alarms of London's 33 local authority areas in 2025: 4,248, or 11.6 a day and 9.0% of the London total. Camden (2,655) and Kensington and Chelsea (2,369) were next. Kingston upon Thames had the fewest, 560.
Non-residential AFA false alarms attended between 07:00 and 20:30 were lower in the year after the change than in the year before in 33 of the 33 areas (32 boroughs and the City of London). The largest fall in number was in Westminster, from 1,978 to 915 (-53.7%). The largest percentage fall was in Kingston upon Thames, from 223 to 66 (-70.4%), and the smallest percentage change was in Greenwich, from 332 to 242 (-27.1%).
The counts are not adjusted for population or for the number of buildings and alarm systems in each area. A borough with more buildings will tend to have more incidents. Select a borough for its own page.
One square for each of the 32 boroughs and the City of London, in rough geographic position. Deeper orange means more attendances. Each square links to that borough’s page.
Key: AFA false alarms in 2025
Most: Westminster, 4,248. Fewest: Kingston upon Thames, 560. The three-letter codes are listed beside each name in the table below, which holds the same figures.
| Rank | Borough | AFA false alarms | Daytime non-residential |
|---|---|---|---|
| 1 | Westminster WST | 4,248 | -53.7% |
| 2 | Camden CMD | 2,655 | -39.8% |
| 3 | Kensington and Chelsea KNS | 2,369 | -52.5% |
| 4 | Lambeth LAM | 2,146 | -63.6% |
| 5 | Southwark SWR | 2,005 | -43.3% |
| 6 | Tower Hamlets TWH | 1,807 | -56.9% |
| 7 | Barnet BRN | 1,750 | -38.4% |
| 8 | Hammersmith and Fulham HMS | 1,718 | -51.9% |
| 9 | Croydon CRD | 1,692 | -49.9% |
| 10 | Hackney HCK | 1,636 | -48.8% |
| 11 | Lewisham LSH | 1,599 | -58.9% |
| 12 | Wandsworth WNS | 1,593 | -62.0% |
| 13 | Islington ISL | 1,569 | -57.8% |
| 14 | Ealing EAL | 1,466 | -61.4% |
| 15 | Hillingdon HDN | 1,394 | -58.8% |
| 16 | Brent BRT | 1,355 | -69.9% |
| 17 | Waltham Forest WTH | 1,323 | -46.3% |
| 18 | Greenwich GRN | 1,270 | -27.1% |
| 19 | Newham NWM | 1,267 | -58.0% |
| 20 | Bromley BRM | 1,241 | -47.1% |
| 21 | Sutton STN | 1,231 | -50.0% |
| 22 | Haringey HGY | 1,191 | -44.9% |
| 23 | Hounslow HNS | 1,146 | -61.5% |
| 24 | Enfield ENF | 854 | -63.6% |
| 25 | Redbridge RDB | 851 | -46.9% |
| 26 | Havering HVG | 841 | -41.4% |
| 27 | Harrow HRW | 833 | -52.6% |
| 28 | Merton MRT | 767 | -55.4% |
| 29 | Bexley BXL | 716 | -55.6% |
| 30 | Barking and Dagenham BAR | 687 | -68.8% |
| 31 | Richmond upon Thames RCH | 684 | -54.4% |
| 32 | City of London CTY | 574 | -60.4% |
| 33 | Kingston upon Thames KNG | 560 | -70.4% |
| London | 47,038 | -53.4% |
Daytime non-residential attendance was lower in the year after the change in 33 of the 33 areas. Small boroughs have small counts, so their percentages move more. Full figures for every year are in the CSV.
In 2025 the hour with the most AFA false alarms was 20:00 to 20:59 (2,670) and the hour with the fewest was 04:00 to 04:59 (1,028). Friday had the highest daily average (134.3) and Sunday the lowest (121.3).
The figures for non-residential buildings show why the evening stands out. In 2025 the Brigade attended 309 non-residential AFA false alarms in the hour from 19:00 and 613 in the hour from 20:00, when daytime attendance resumes. The half-hour chart shows the step.
All property types, all of London. Each cell is the number attended in that hour on that day of the week across the year.
| Hour | Mon | Tue | Wed | Thu | Fri | Sat | Sun | All days |
|---|---|---|---|---|---|---|---|---|
| 00:00 | 217 | 205 | 220 | 215 | 213 | 211 | 222 | 1,503 |
| 01:00 | 171 | 186 | 180 | 157 | 208 | 238 | 196 | 1,336 |
| 02:00 | 142 | 162 | 159 | 151 | 185 | 181 | 189 | 1,169 |
| 03:00 | 152 | 157 | 135 | 153 | 149 | 180 | 137 | 1,063 |
| 04:00 | 145 | 129 | 146 | 136 | 144 | 171 | 157 | 1,028 |
| 05:00 | 142 | 139 | 139 | 139 | 157 | 159 | 154 | 1,029 |
| 06:00 | 213 | 178 | 179 | 191 | 218 | 167 | 141 | 1,287 |
| 07:00 | 192 | 189 | 187 | 184 | 210 | 159 | 129 | 1,250 |
| 08:00 | 257 | 259 | 252 | 288 | 266 | 213 | 167 | 1,702 |
| 09:00 | 322 | 355 | 366 | 345 | 333 | 280 | 235 | 2,236 |
| 10:00 | 351 | 392 | 408 | 428 | 374 | 300 | 286 | 2,539 |
| 11:00 | 349 | 407 | 438 | 392 | 414 | 306 | 295 | 2,601 |
| 12:00 | 360 | 401 | 425 | 380 | 358 | 330 | 329 | 2,583 |
| 13:00 | 324 | 373 | 383 | 360 | 383 | 334 | 356 | 2,513 |
| 14:00 | 345 | 347 | 410 | 378 | 324 | 330 | 344 | 2,478 |
| 15:00 | 315 | 323 | 346 | 310 | 312 | 330 | 332 | 2,268 |
| 16:00 | 324 | 290 | 335 | 310 | 330 | 321 | 366 | 2,276 |
| 17:00 | 334 | 325 | 337 | 337 | 324 | 337 | 323 | 2,317 |
| 18:00 | 328 | 351 | 387 | 346 | 365 | 334 | 358 | 2,469 |
| 19:00 | 320 | 380 | 341 | 342 | 349 | 320 | 340 | 2,392 |
| 20:00 | 365 | 367 | 406 | 370 | 398 | 361 | 403 | 2,670 |
| 21:00 | 340 | 337 | 316 | 360 | 374 | 358 | 325 | 2,410 |
| 22:00 | 273 | 298 | 296 | 307 | 318 | 303 | 285 | 2,080 |
| 23:00 | 253 | 277 | 257 | 266 | 280 | 265 | 241 | 1,839 |
| All hours | 6,534 | 6,827 | 7,048 | 6,845 | 6,986 | 6,488 | 6,310 | 47,038 |
The Index describes what the Brigade attended. What you do about your own alarms is a matter for your fire risk assessment and the people who maintain the system. The points below are general, and follow London Fire Brigade’s own advice in Guidance Note 54: Managing and reducing false alarms and its guide to fire alarm systems.
Offices, shops, warehouses and other non-exempt buildings
An alarm signal alone no longer brings a crew in these hours. A 999 call that confirms a fire does, at any time.
Blocks of flats, sheltered housing, student halls and other residential buildings
Residential buildings get a response at every hour, and they are where most AFA false alarms are attended: 76.1% of the 2025 total.
Gemini AMPM designs, installs, maintains and monitors fire alarm systems across London and the South East. If false alarms are a problem in your building, send us the panel’s event log and we will start there.
London Fire Brigade attended 47,038 automatic fire alarm (AFA) false alarms in 2025, an average of 128.9 a day. That was 34.1% of the 137,981 incidents it attended and 76.2% of its 61,751 false alarms. So far in 2026 (1 January to 31 July 2026) it has attended 28,591, against 26,001 in the same dates of 2025.
Yes, but not everywhere at every hour. Since 29 October 2024, between 07:00 and 20:30, the Brigade does not attend an automatic fire alarm at most non-residential buildings unless a person also calls 999 to report a fire. It still attends automatic fire alarms at any building between 20:30 and 07:00, and at homes and other exempt premises at all times. The full policy is on London Fire Brigade’s AFA policy page.
The Brigade’s policy page lists these as exempt, which means crews attend an automatic fire alarm there without confirmation of a fire: private dwellings and houses; flats, including high-rise; houses in Multiple Occupation; mobile and park homes; houseboats; hospitals; residential care homes, nursing homes and hospices; children's homes; specialised housing premises (for example sheltered housing, extra care sheltered housing, supported living); student accommodation and halls of residence; residential boarding schools; hotels, motels, B&Bs and other guest accommodation; hostels (for example homeless, rehabilitation) and youth hostels; prisons, young offenders' institutions and other secure establishments; Grade 1, Grade 2 and Grade 2S listed heritage buildings; schools; nurseries; buildings of substantial public significance identified as exempt by London Fire Brigade. The Brigade asks exempt premises to make sure whoever calls 999 knows the building is exempt and says so, and not to assume an exemption. Check the current list before you rely on it.
It has cut the number the Brigade attends. After LFB changed its response on 29 October 2024, AFA false alarms attended at non-residential properties between 07:00 and 20:30 fell from 13,713 in the year before (29 October 2023 to 28 October 2024) to 6,396 in the year after (29 October 2024 to 28 October 2025), a change of -53.4%. Outside those hours non-residential attendances went from 5,304 to 4,874 (-8.1%). Residential attendances went from 33,729 to 35,232 (+4.5%), and all AFA false alarms from 52,793 to 46,536 (-11.9%). The records count attendances, so they cannot show how many alarms sounded and were not attended.
Westminster had the most AFA false alarms of London's 33 local authority areas in 2025: 4,248, or 11.6 a day and 9.0% of the London total. Camden (2,655) and Kensington and Chelsea (2,369) were next. Kingston upon Thames had the fewest, 560. The counts are not adjusted for population or for the number of buildings, so a borough with more buildings will tend to have more. The league table ranks all 33 areas.
Follow your emergency plan. For a building that is not exempt, the Brigade’s guidance is to have a safe way for trained staff to investigate the alarm, and to call 999 as soon as there is any sign of fire, such as smoke, flames, heat or the smell of burning. Do not wait for a crew to arrive first: between 07:00 and 20:30 one will not be sent on the alarm signal alone. LFB Guidance Note 54 covers safe investigation and the policy FAQs cover what the control room will ask.
The notional cost recorded against AFA false alarms in 2025 was £22,472,940, and the pump time recorded was 2,941,997 minutes (49,033.3 hours). 43,118 of the 47,038 incidents carry the 60-minute minimum that LFB applies to any incident of under an hour, so the recorded time is not time on scene. LFB's metadata defines notional cost as time spent multiplied by the notional annual cost of a pump. It is a notional figure and not a bill to any building owner. The rate behind it rises each April, so totals in different years are not like for like. More detail is in the methodology.
One row for each area and period: 33 areas plus a London total, calendar years 2019 to 2025 and 2026 to 31 July. Column definitions are in the README.
Definitions, filters, the checks run on every figure and the reconciliation with totals published by London Fire Brigade and by government are on the methodology page.
London Fire Brigade publishes its incident records on the London Datastore. This Index is refreshed when new data is published. This edition was generated on 5 October 2026 from files dated 25 August 2026, and covers incidents to 31 July 2026.
Source: London Fire Brigade, London Fire Brigade Incident Records, published on the London Datastore (data.london.gov.uk). Contains public sector information licensed under the Open Government Licence v2.0. The Greater London Authority cannot warrant the quality or accuracy of the data. This analysis is by Gemini AMPM. It is not endorsed by, affiliated with or approved by London Fire Brigade or the Greater London Authority.
Gemini AMPM (2026). London False Alarm Index: automatic fire alarm false alarms attended by London Fire Brigade, 2019 to 31 July 2026. https://geminiampm.co.uk/false-alarm-index/ (data: London Fire Brigade Incident Records, London Datastore, Open Government Licence v2.0).
Journalists and researchers: you may quote the figures and reuse the charts with that credit. For anything not on the page, email [email protected].
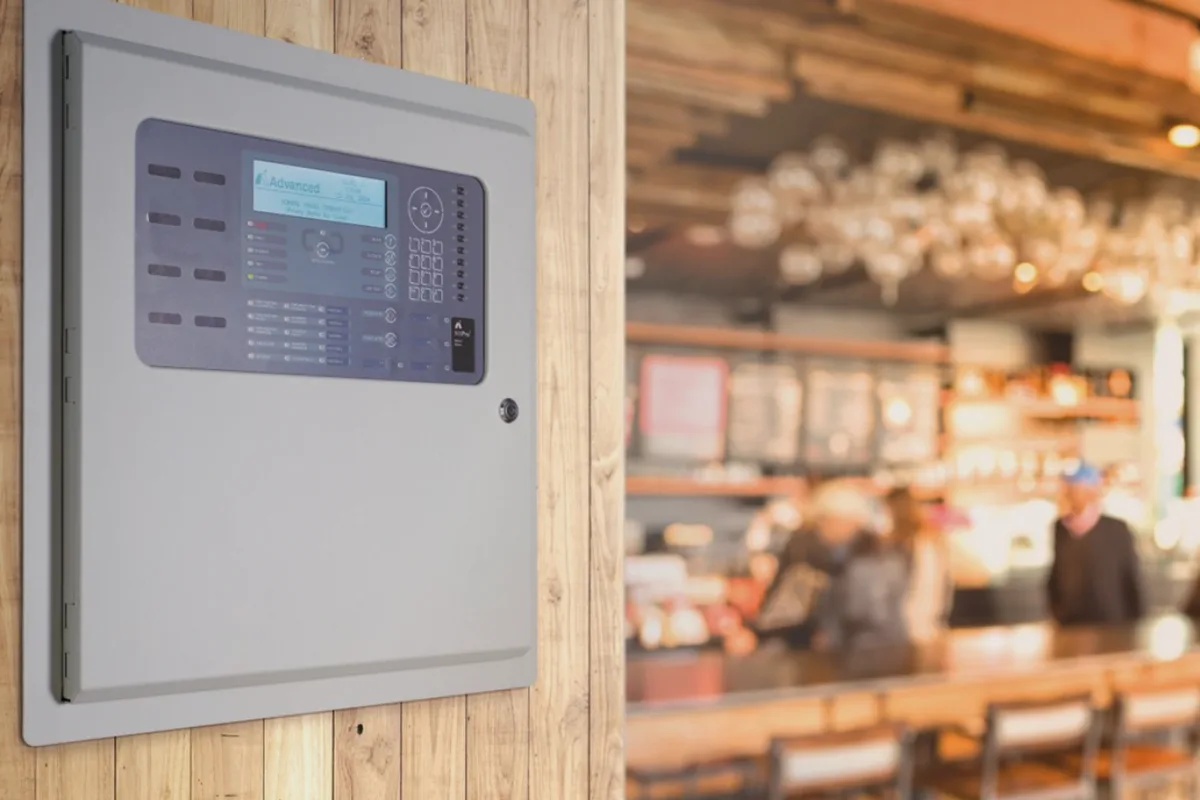
What BS 5839-1:2025 requires of a fire alarm maintenance contract, what a proper service visit covers, and the red flags in a cheap quote.

The Redcare era is over. Keyholder response, app alerts and ARC monitoring compared: who watches, who calls the fire service, what insurers accept.
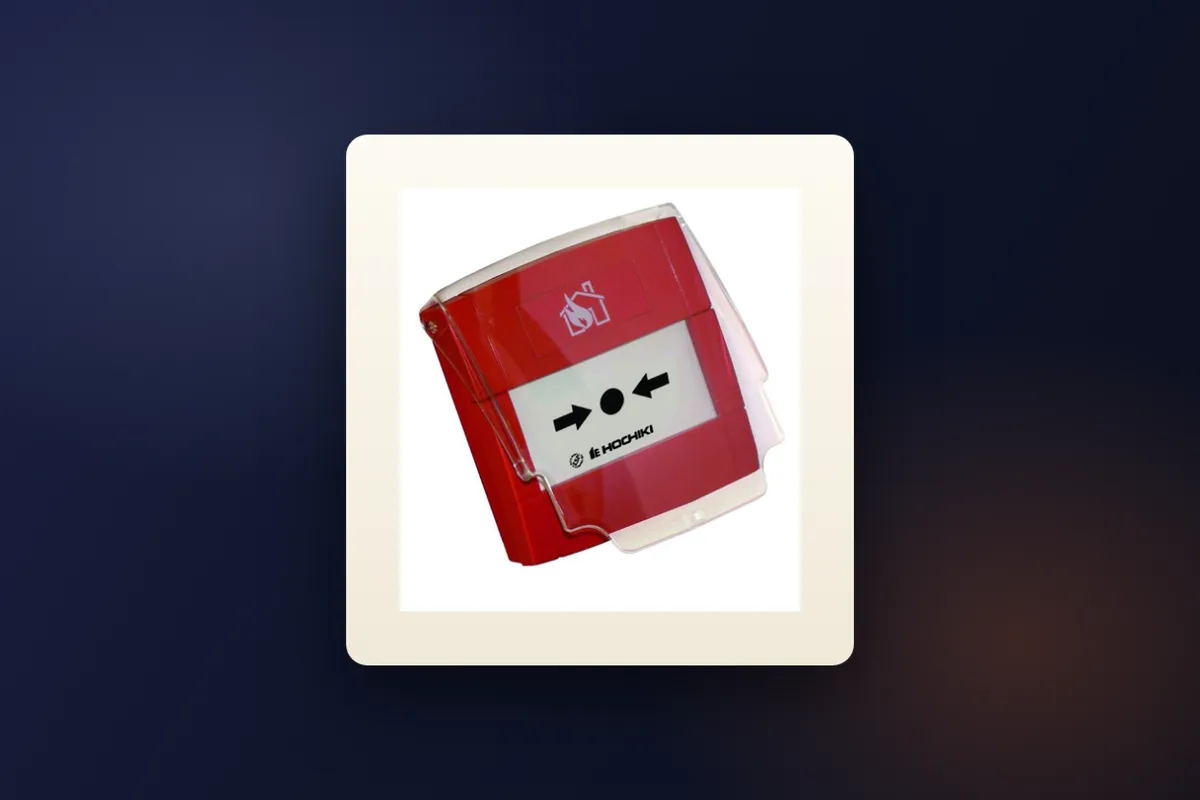
A Somerset guest house was ordered to pay £33,700 after inspectors found nine fire alarm faults and no risk assessment. What to check in your building.